
Planning for growth is essential—but planning alone isn’t enough. Without a clear understanding of risk, even the best projections can lead your team into surprises. At Nue Information, we’ve found that visualizing your pipeline assumptions brings immediate clarity to the biggest driver of your revenue plan: new business.
In this post, we explore three visual scenarios that all point to the same revenue target—$50M—but each carries a dramatically different risk profile. Let’s walk through them to highlight how strategic leaders can better manage risk, timing, and expectations using the visual tools in our platform.
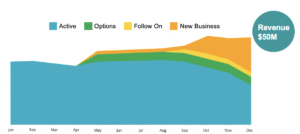
Scenario 1: Balanced and Measured Growth
In this plan, revenue from active contracts (blue) remains strong and steady throughout the year. Growth begins modestly in May with new business (orange) and expands in Q4, supported by options and follow-ons (green and yellow). This is what a well-paced, diversified plan looks like.
Key Insight:
The ramp is realistic, the timing allows for operational prep, and no single bucket (e.g., new business) is carrying an outsized risk. From a pipeline confidence perspective, this is the least risky plan.
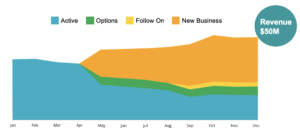
Scenario 2: Steep Decline in Active Work, Heavy Bet on New Business
Here, the $50M goal is still in place—but active work drops sharply after Q1, making room for a heavy lift by new business wins starting mid-year.
Key Insight:
If you’re in January or February, this scenario demands urgent attention. Your year depends on wins that haven’t happened yet, and that must both replace lost revenue and deliver net growth. Risk levels rise, and questions about pipeline realism, probability of win (pWin), staffing, and execution timing become critical.
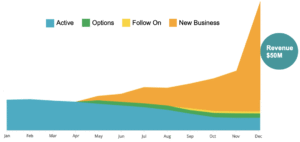
Scenario 3: The “Hockey Stick” Plan
This version of the plan is the most visually dramatic: a steady state of revenue from active work, followed by a massive surge in new business right at the end of the year.
Key Insight:
This “hockey stick” pattern is often a red flag. It signals a bet on late-stage catch-up, potentially reflecting underperformance or overly optimistic assumptions. While hope isn’t a strategy, it often sneaks into plans when risk isn’t adequately visualized. This scenario demands backup plans, alternative pathways, and contingency budgeting.
How Nue Helps You See—and Manage—Risk
Our platform doesn’t just track contracts—it enables strategic risk assessment:
- Visual dashboards like the ones above show how pipeline stages (Active, Options, Follow-Ons, and New Business) support your plan.
- Detailed reports let you drill into assumptions by contract status, timing, and pWin.
- Scenario filters help you test what happens if wins are delayed, downsized, or lost.
By integrating your factored pipeline into visual, dynamic tools, Nue gives you a way to move from static plans to strategic, risk-aware decisions.
Ready to Replace Guesswork with Clarity?
Let us show you how Nue can turn your pipeline assumptions into a powerful forecasting edge. Contact us to schedule a demo or explore more about how our clients manage scenario risk with confidence.